Sales KPIs Every Growing Business Should Track
Growing businesses often focus heavily on increasing sales activity. More leads, more calls, more proposals. Yet many companies still struggle with inconsistent revenue growth. The real issue is not activity but visibility. Without clearly defined sales KPIs for growing businesses, leaders cannot understand what is actually driving performance or where problems exist in the sales process.
Sales KPIs provide measurable indicators that help businesses track progress, evaluate team performance, and make data-driven decisions. When organizations track the right sales performance metrics, they gain clarity on revenue drivers, pipeline health, and team productivity.
For founders and sales leaders, the key question is not just how much revenue was generated, but what indicators predicted that revenue.
Why Sales KPIs Matter for Growing Businesses
As companies scale, sales operations become more complex. Teams expand, markets diversify, and customer acquisition channels increase. Without structured key sales performance indicators, decision-making becomes reactive rather than strategic.
Tracking the right sales metrics for business growth helps organizations:
Identify strong and weak stages of the sales funnel
Improve forecasting accuracy
Align sales efforts with business strategy
Improve accountability within the sales team
Allocate resources more effectively
Reflective Question:
Are your sales decisions based on data from sales tracking metrics, or mostly based on assumptions?
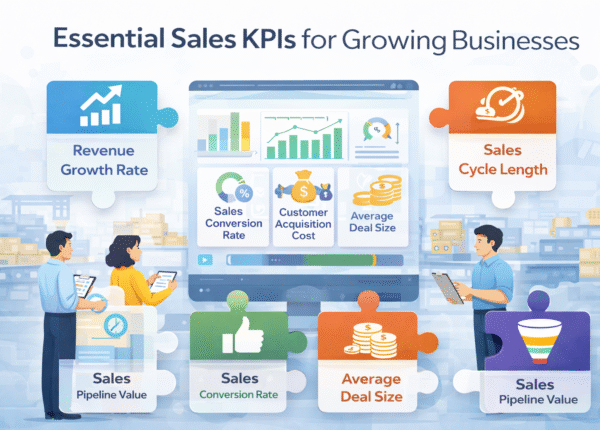
Core Sales KPIs Every Growing Business Should Track
Below are the most important sales KPIs for growing businesses that provide meaningful insight into performance.
Revenue Growth Rate
Revenue growth rate measures how quickly the business is increasing its sales over time. This KPI answers an important question:
Is the business truly scaling, or simply maintaining existing performance?
Formula:
Revenue Growth Rate =
(Current Period Revenue – Previous Period Revenue) ÷ Previous Period Revenue
Example:
A company generated ₹10M last quarter and ₹12M this quarter.
Revenue growth rate = 20%
This KPI helps leadership assess whether strategic initiatives are actually delivering measurable results.
Sales Conversion Rate
Sales conversion rate measures how effectively leads are converted into paying customers. It is one of the most important sales performance metrics because it directly reflects sales effectiveness.
Formula:
Conversion Rate =
(Number of Deals Won ÷ Total Leads) × 100
Example:
If a company receives 200 leads and converts 40 into customers, the conversion rate is 20%.
Improving conversion rates often requires:
stronger sales qualification
improved sales messaging
better follow-up processes
Reflective Question:
Are your sales teams focusing on increasing lead quantity or improving conversion quality?
Average Deal Size
Average deal size shows the typical value of each closed sale. Tracking this KPI helps businesses understand revenue potential and pricing effectiveness.
Formula:
Average Deal Size =
Total Revenue ÷ Number of Closed Deals
Example:
If a company closes 50 deals worth ₹5M in total revenue, the average deal size is ₹100,000.
Increasing deal size may involve:
bundling products or services
improving value communication
targeting higher-value customer segments
Sales Cycle Length
Sales cycle length measures the time it takes to convert a lead into a customer. For many sales KPIs for growing businesses, this metric reveals process inefficiencies.
Formula:
Sales Cycle Length =
Average number of days between first contact and deal closure
Example:
If most deals take 60 days to close, improving the sales process could reduce this to 45 days.
Shorter sales cycles improve:
revenue predictability
sales productivity
cash flow stability
Customer Acquisition Cost (CAC)
Customer Acquisition Cost measures how much it costs to acquire each new customer.
It combines marketing and sales investment into one performance metric.
Formula:
CAC =
Total Sales & Marketing Costs ÷ Number of Customers Acquired
Example:
If a company spends ₹500,000 on sales and marketing and acquires 100 customers, CAC equals ₹5,000 per customer. Healthy businesses track CAC alongside revenue metrics to maintain sustainable growth.
Sales Pipeline Value
Sales pipeline value represents the total potential revenue currently in the pipeline. This metric helps leaders evaluate whether the pipeline is strong enough to achieve future targets.
Example:
If a company needs ₹10M in revenue next quarter but the pipeline contains only ₹6M worth of deals, corrective action is required. Tracking sales pipeline metrics improves forecasting accuracy and strategic planning.
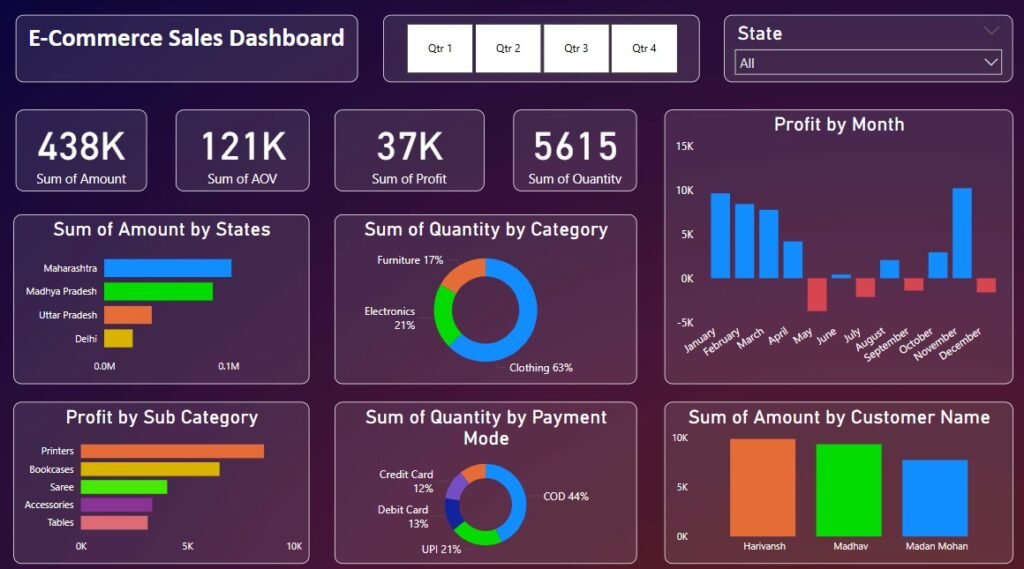
How to Build a Sales KPI Dashboard
Tracking individual metrics is helpful, but performance becomes clearer when KPIs are visualized together.
A well-structured sales dashboard metrics system should include:
Pipeline indicators
pipeline value
lead qualification rate
opportunity progression
Revenue indicators
revenue growth rate
average deal size
closed deal value
Efficiency indicators
sales cycle length
customer acquisition cost
conversion rate
Example:
A growing manufacturing company implemented a weekly KPI dashboard covering pipeline value, conversion rates, and average deal size. Within six months, leadership identified a bottleneck in proposal follow-ups and improved the conversion rate significantly.
Common Mistakes Businesses Make When Tracking Sales KPIs
Many organizations collect sales data but fail to use it effectively. Common mistakes include:
Tracking too many metrics
Too many KPIs create confusion rather than clarity.
Ignoring pipeline indicators
Revenue alone does not reveal future performance.
Not linking KPIs to accountability
Sales metrics must align with team roles and responsibilities.
Reviewing KPIs only monthly
Frequent monitoring improves responsiveness.
Reflective Question:
Are your sales KPIs helping leaders make decisions, or simply producing reports?
Practical KPI Framework for Growing Businesses
A simple KPI structure can significantly improve sales performance visibility.
Strategic KPIs
revenue growth rate
market expansion revenue
Pipeline KPIs
sales pipeline value
opportunity conversion rate
Performance KPIs
average deal size
sales cycle length
Efficiency KPIs
customer acquisition cost
lead-to-customer ratio
This framework ensures businesses track both short-term activity and long-term growth indicators.
Final Thoughts
Tracking the right sales KPIs for growing businesses allows leaders to move from reactive sales management to structured performance management.
Sales growth does not come from activity alone. It comes from understanding the metrics that drive performance and continuously refining strategy based on those insights.
When organizations track meaningful sales performance metrics, they gain clarity on what works, where improvements are needed, and how to scale revenue sustainably.
Frequently Asked Questions (FAQS)
Growing businesses should track revenue growth rate, conversion rate, average deal size, sales cycle length, customer acquisition cost, and pipeline value to measure overall sales performance.
Sales performance can be measured by monitoring key indicators such as pipeline value, conversion rates, revenue growth, deal size, and customer acquisition cost.
Examples include lead-to-customer ratio, opportunity conversion rate, sales cycle duration, pipeline coverage ratio, and average deal value.
Small businesses should prioritize conversion rate, customer acquisition cost, pipeline value, revenue growth rate, and average deal size.
An effective dashboard combines pipeline metrics, revenue indicators, and efficiency metrics so leadership can track performance and identify bottlenecks quickly.
Related posts
- Essential Sales KPIs for Growing Businesses
"Learn what Change Management is, why it’s critical for businesses, key models, challenges, and real-world examples of successful...
- Pricing Models Types: Explained with Real-World Examples
"Learn about different types of pricing models with real-world examples. Discover which pricing strategy works best for businesses...
- Labour Migration Challenges in India and Business Impact
"Learn what Change Management is, why it’s critical for businesses, key models, challenges, and real-world examples of successful...